
Camera traps and scat DNA produced similar tiger-density estimates in Chitwan
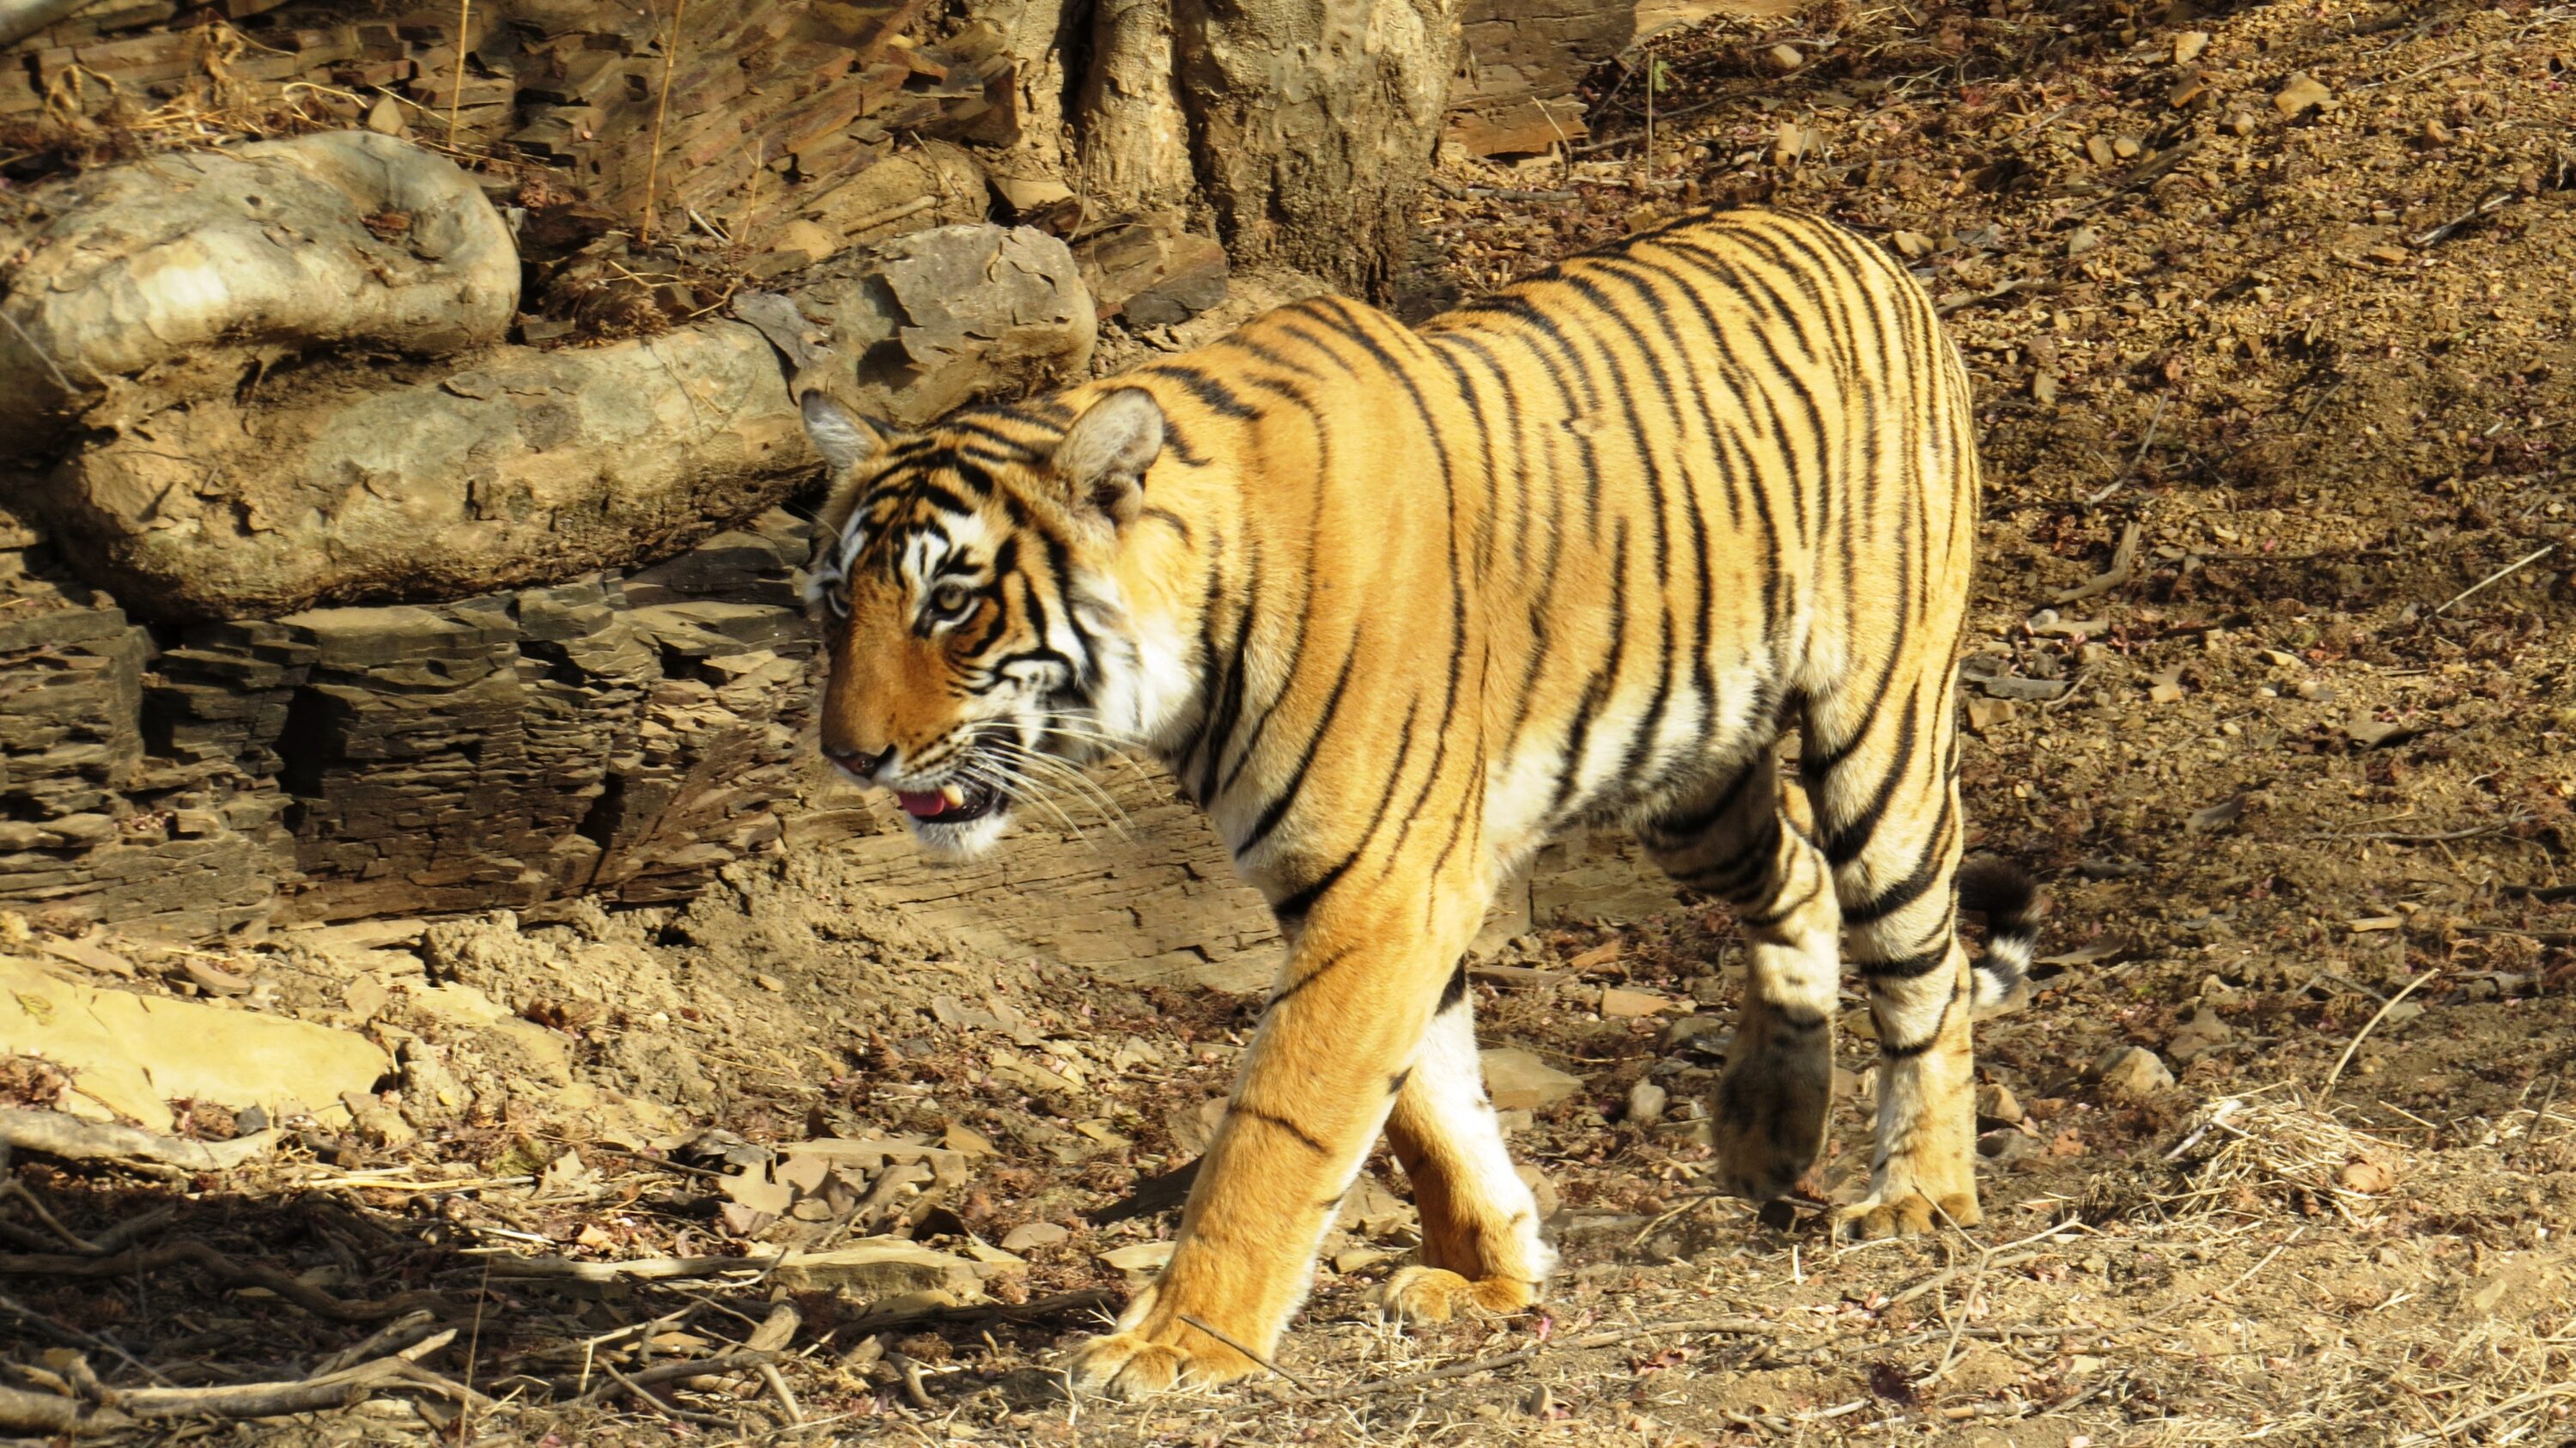
How many tigers (Panthera tigris) use the lowland forest of Chitwan National Park, Nepal? Camera-trap photographs and DNA from tiger scat gave researchers broadly similar estimates of tiger density, although the DNA-based estimates of total abundance were higher and less precise. The surveys took place in different years and lasted for different lengths of time, so the results cannot show whether the population changed or whether one method is generally better. The study was published on 4 November 2026.
The camera survey covered 359.2 km² in 2009. Cameras at 187 locations produced 264 identifiable photographs, representing 103 capture events for 41 tigers. In 2011, field teams walked 1,173 km of routes in the same general lowland forest, collecting 257 scat samples across about 325 km². DNA profiles from eight genetic markers identified 31 tigers and yielded 42 recaptures. The camera survey ran for 105 days, compared with 42 days for the scat survey. Because individual tigers could be identified more than once, both data sets could be used to estimate how many animals had gone undetected.
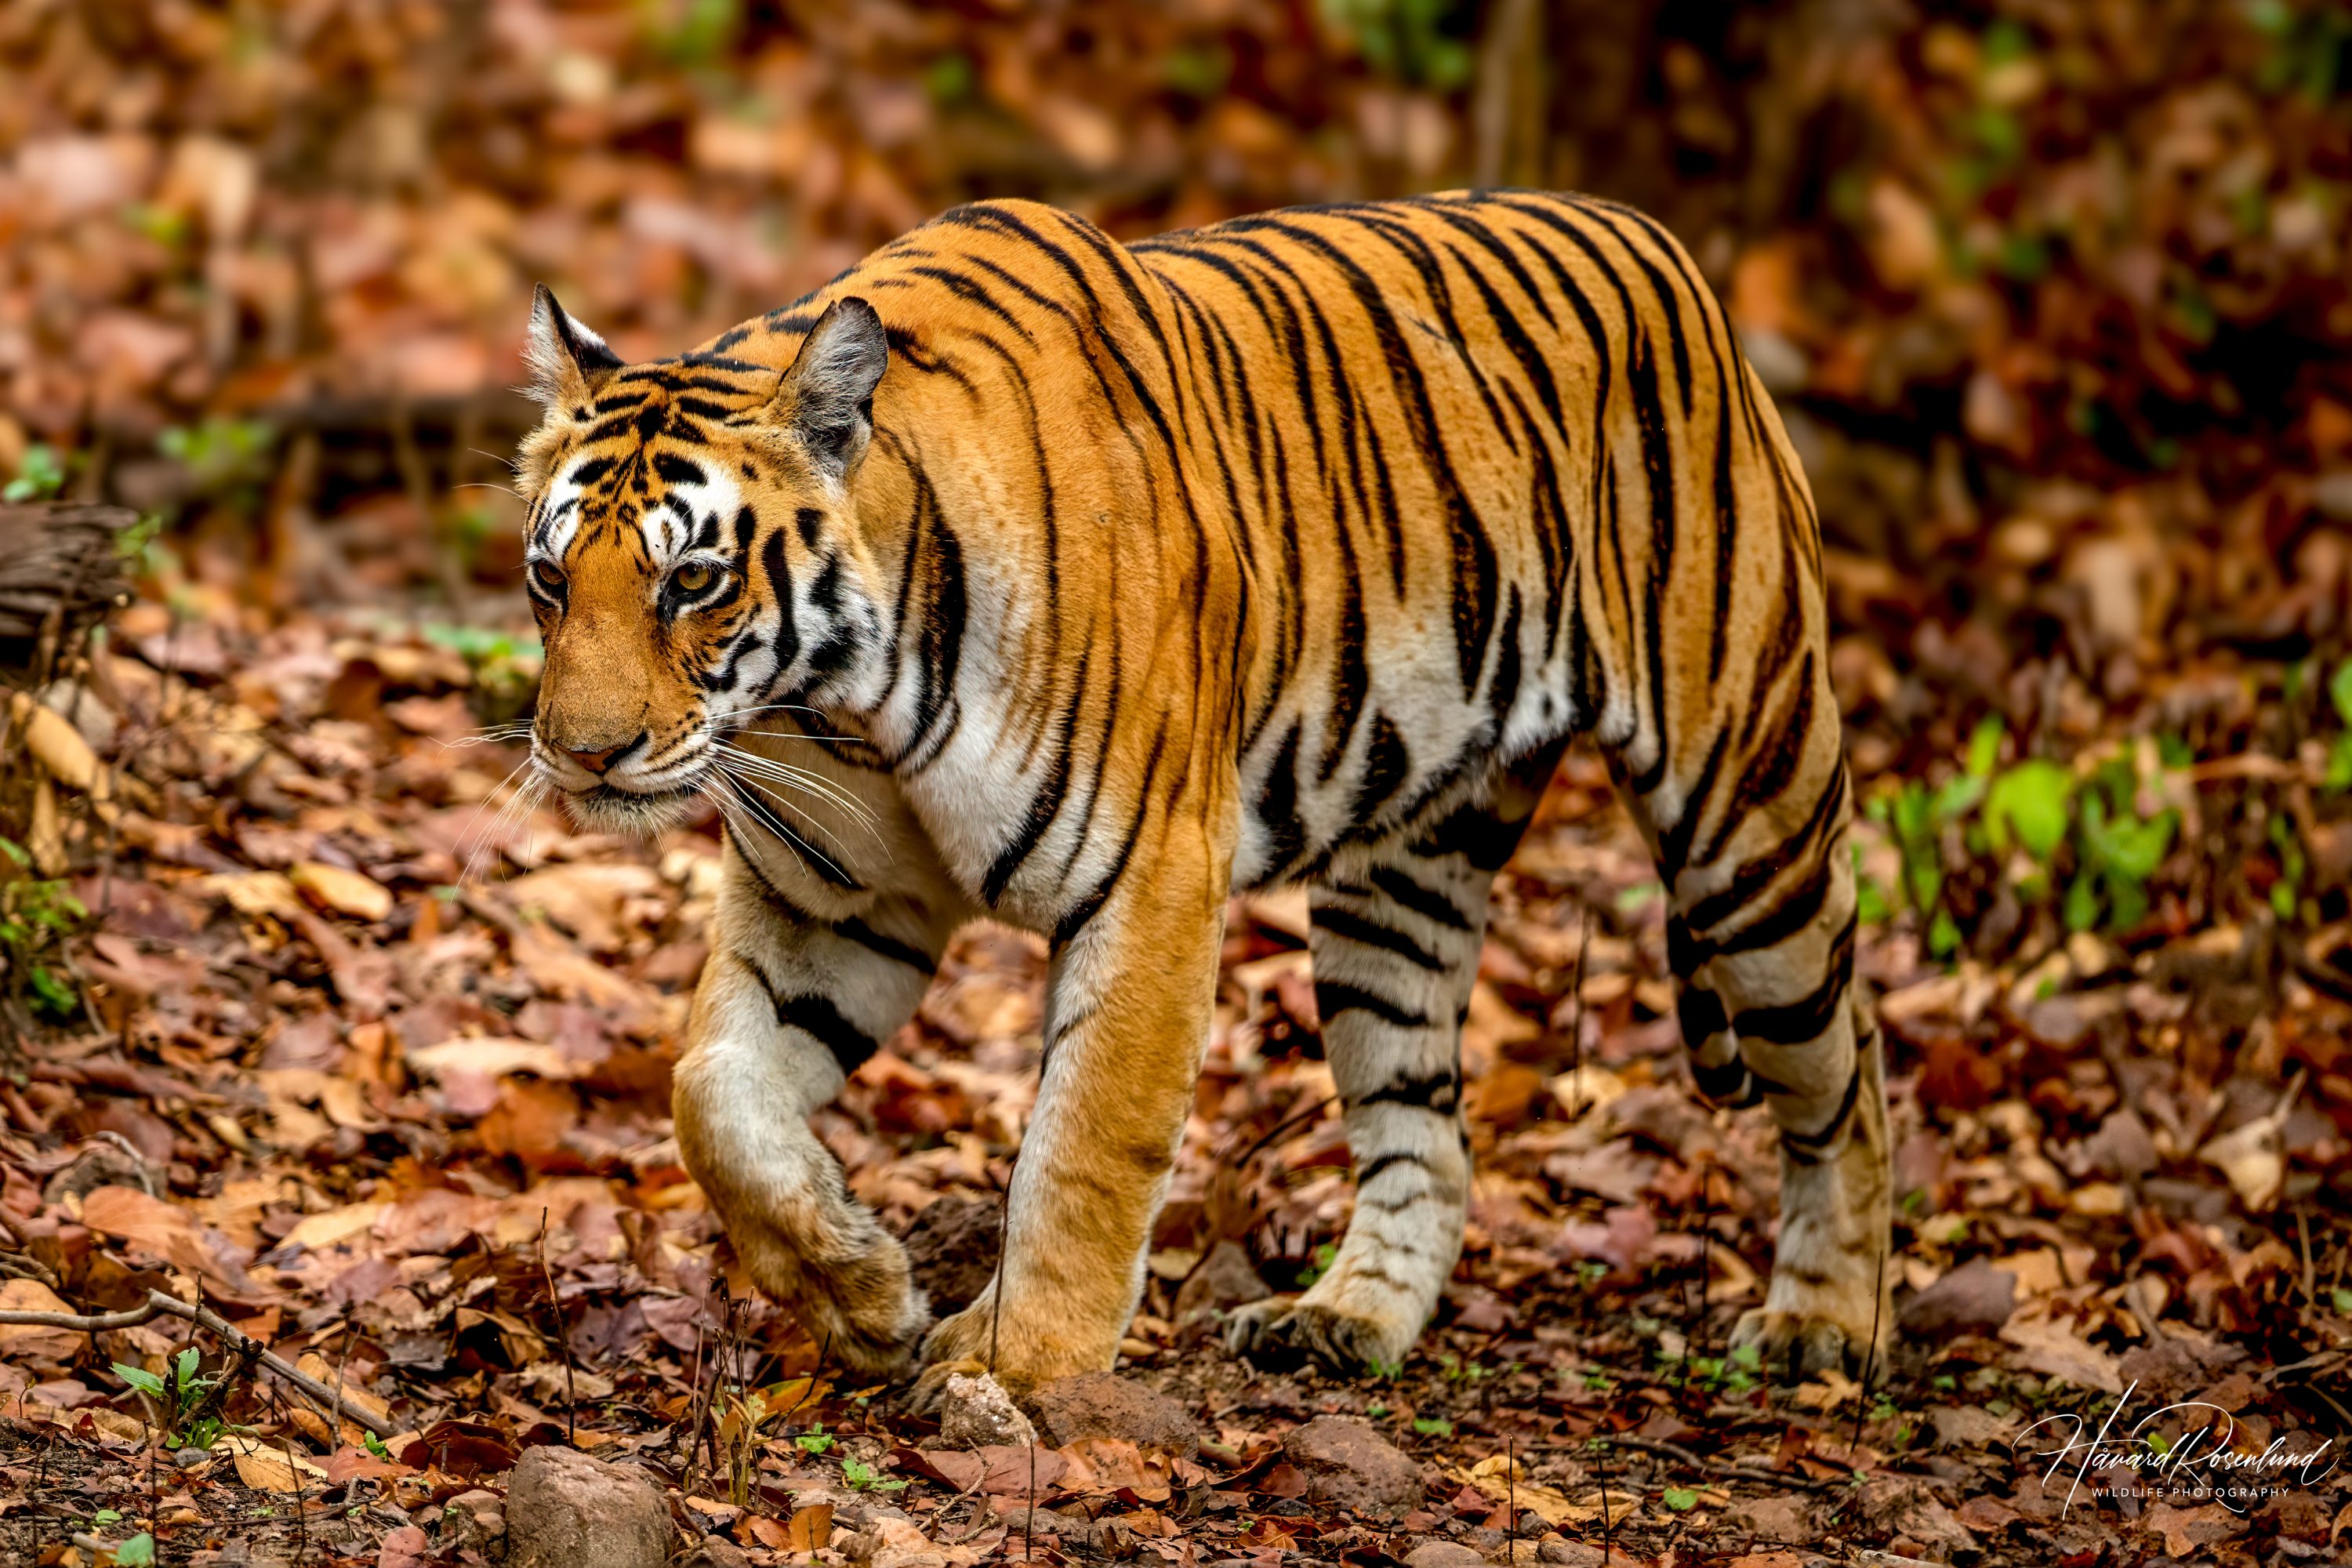
The researchers used spatial capture–recapture, which considers both how often an individual is detected and where those detections occur. Camera images identify tigers by their stripe patterns; DNA profiles identify them from scat. The distances between repeat detections help estimate the scale of tiger movement and, in turn, how many animals use the surveyed area. The method also accounts for tigers that may not be detected.
Similar density estimates, higher abundance estimates from DNA
The researchers estimated density using two statistical approaches: maximum-likelihood and Bayesian analyses. The resulting estimates were close between the data sets. In the maximum-likelihood analysis, density was estimated at 2.55 tigers per 100 km² from camera data and 2.57 from genetic data. The Bayesian analysis estimated 2.44 from cameras and 2.23 from DNA. Both approaches therefore put the two data sets in a similar range for the surveyed forest.
Estimates of total abundance differed more: the maximum-likelihood analysis put the number at about 66 tigers from camera data and 88 from DNA; the Bayesian analysis estimated about 64 and 93, respectively. The uncertainty ranges overlapped, so the higher DNA estimates do not establish that there were actually more tigers. These figures describe the surveyed core lowland forest, not the whole national park.
The genetic estimates were less precise in part because few tigers were detected again at a different sampling location. Of the 31 tigers identified from scat, 14 were found more than once, and fewer were detected elsewhere. Such spatial repeat detections help estimate how far tigers move. If repeat detections are concentrated at the same or nearby places, the movement scale can be underestimated, which can make calculated density too high. The authors suggest that tigers’ reuse of scent-marked routes and latrine sites may also lead to repeated scat detections in the same places.
Fine-scale maps were less comparable
Although average density estimates were similar, the methods produced markedly different maps of where density appeared highest. Cameras record animals at fixed points, whereas scat was collected along routes. The authors also point to differences in the estimated detection patterns. Both surveys focused on trails and other places tigers were likely to use, leaving gaps in the sampled area. Tigers whose home ranges fell entirely within those gaps could have been missed, potentially lowering estimates of both abundance and density. The authors therefore consider the average density estimates more useful to compare than the detailed maps, which may show where each method recorded tigers rather than how tigers were distributed across the whole landscape.
This study provides the first empirical estimates of tiger density and abundance from non-invasive genetic sampling in Nepal’s part of the Terai Arc Landscape, alongside estimates from camera traps. It shows how DNA from scat can contribute to tiger monitoring when individual animals can be identified and detected at different locations. The authors suggest that genetic surveys could yield more spatial repeat detections by using denser or more frequently repeated routes.
Ecology
Related news
A lion liver protein was a poor hepatitis B virus receptor—and a less efficient bile-acid transporter
Tests of NTCP proteins from cats, tigers and leopards supported hepatitis B virus binding, unlike lion NTCP, which…
Read story →
Social media portrayed dholes more negatively than three other carnivores
An analysis of more than 6,000 posts compared dholes with Bengal tigers, sloth bears and golden jackals. Dholes…
Read story →
Human Pressures Had No Consistent Link to Tiger and Leopard Space Use
In Northeast China, modeled links between human pressures, prey use, and Amur tiger and leopard space use varied…
Read story →SPECIES IN THIS STORY
Species in this story
Independent research and conservation news archive
Did you find this information useful?
Wildlife Vagabond is independently built and maintained. Voluntary support helps cover source verification, hosting and continued work on research and conservation news.
Support Wildlife VagabondThe news archive will remain freely available.