
Settlement Proximity Was the Strongest Model Predictor of Tiger and Leopard Livestock Depredation in Panna
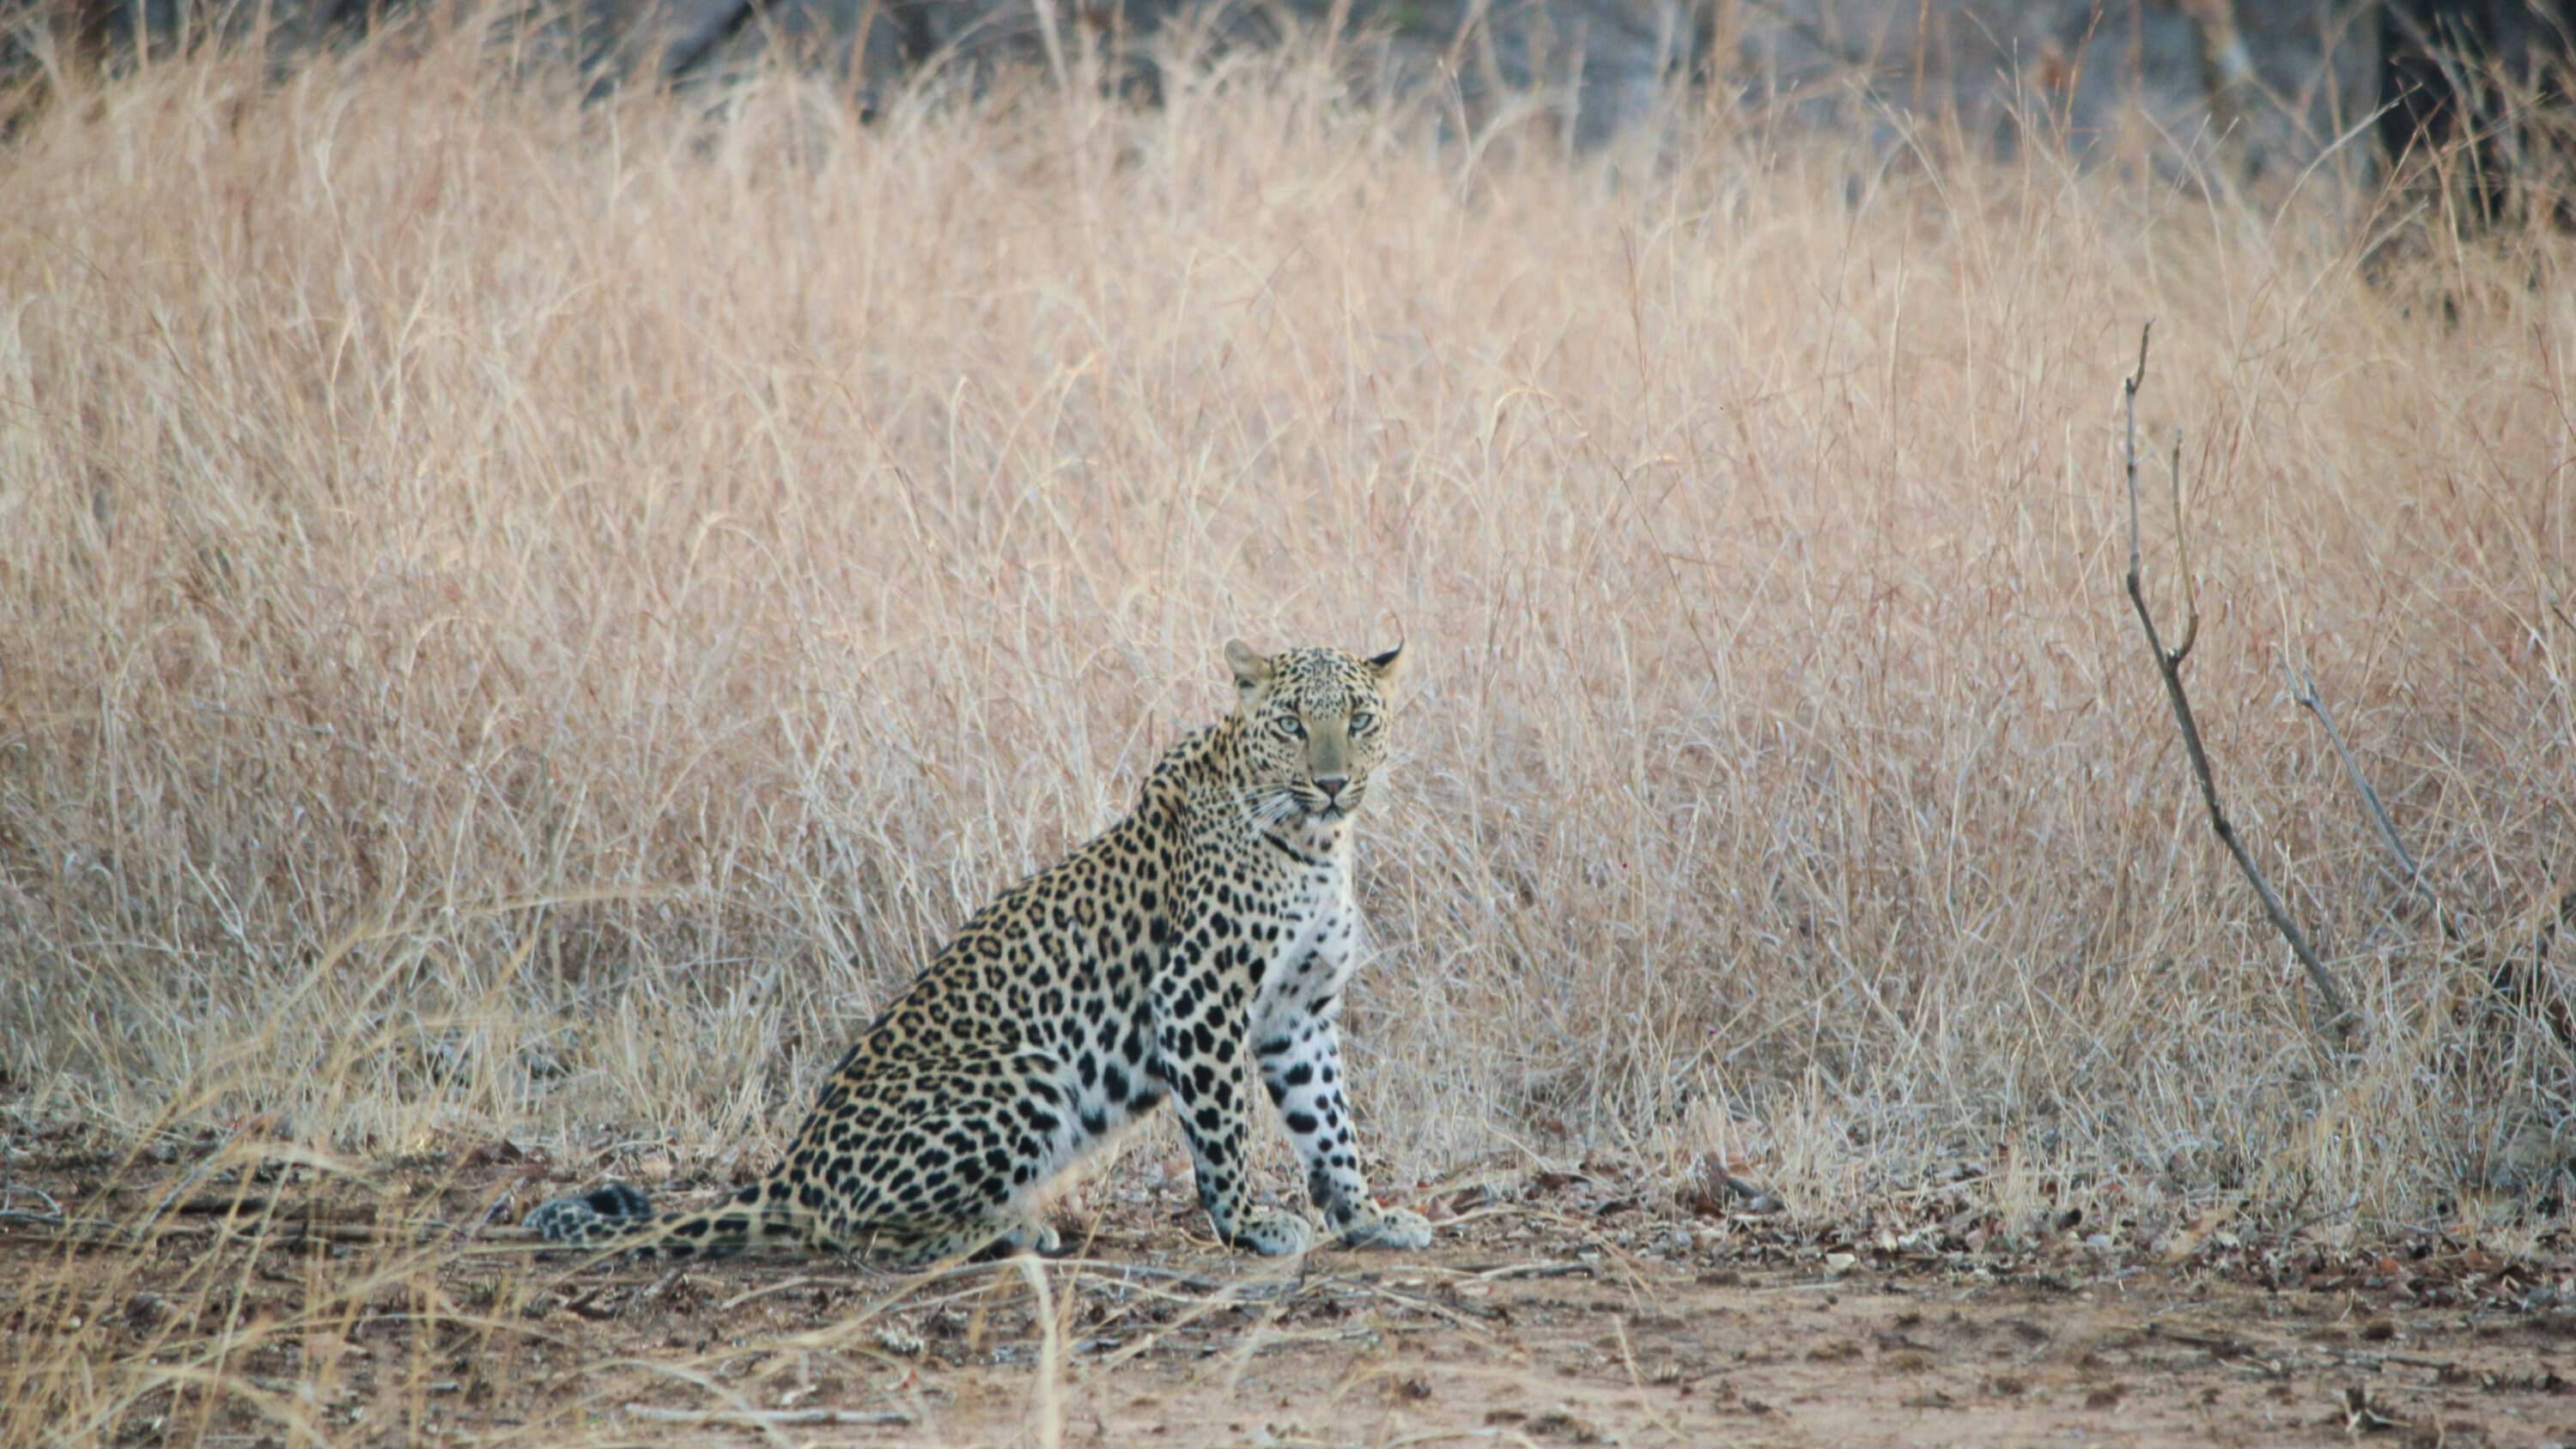
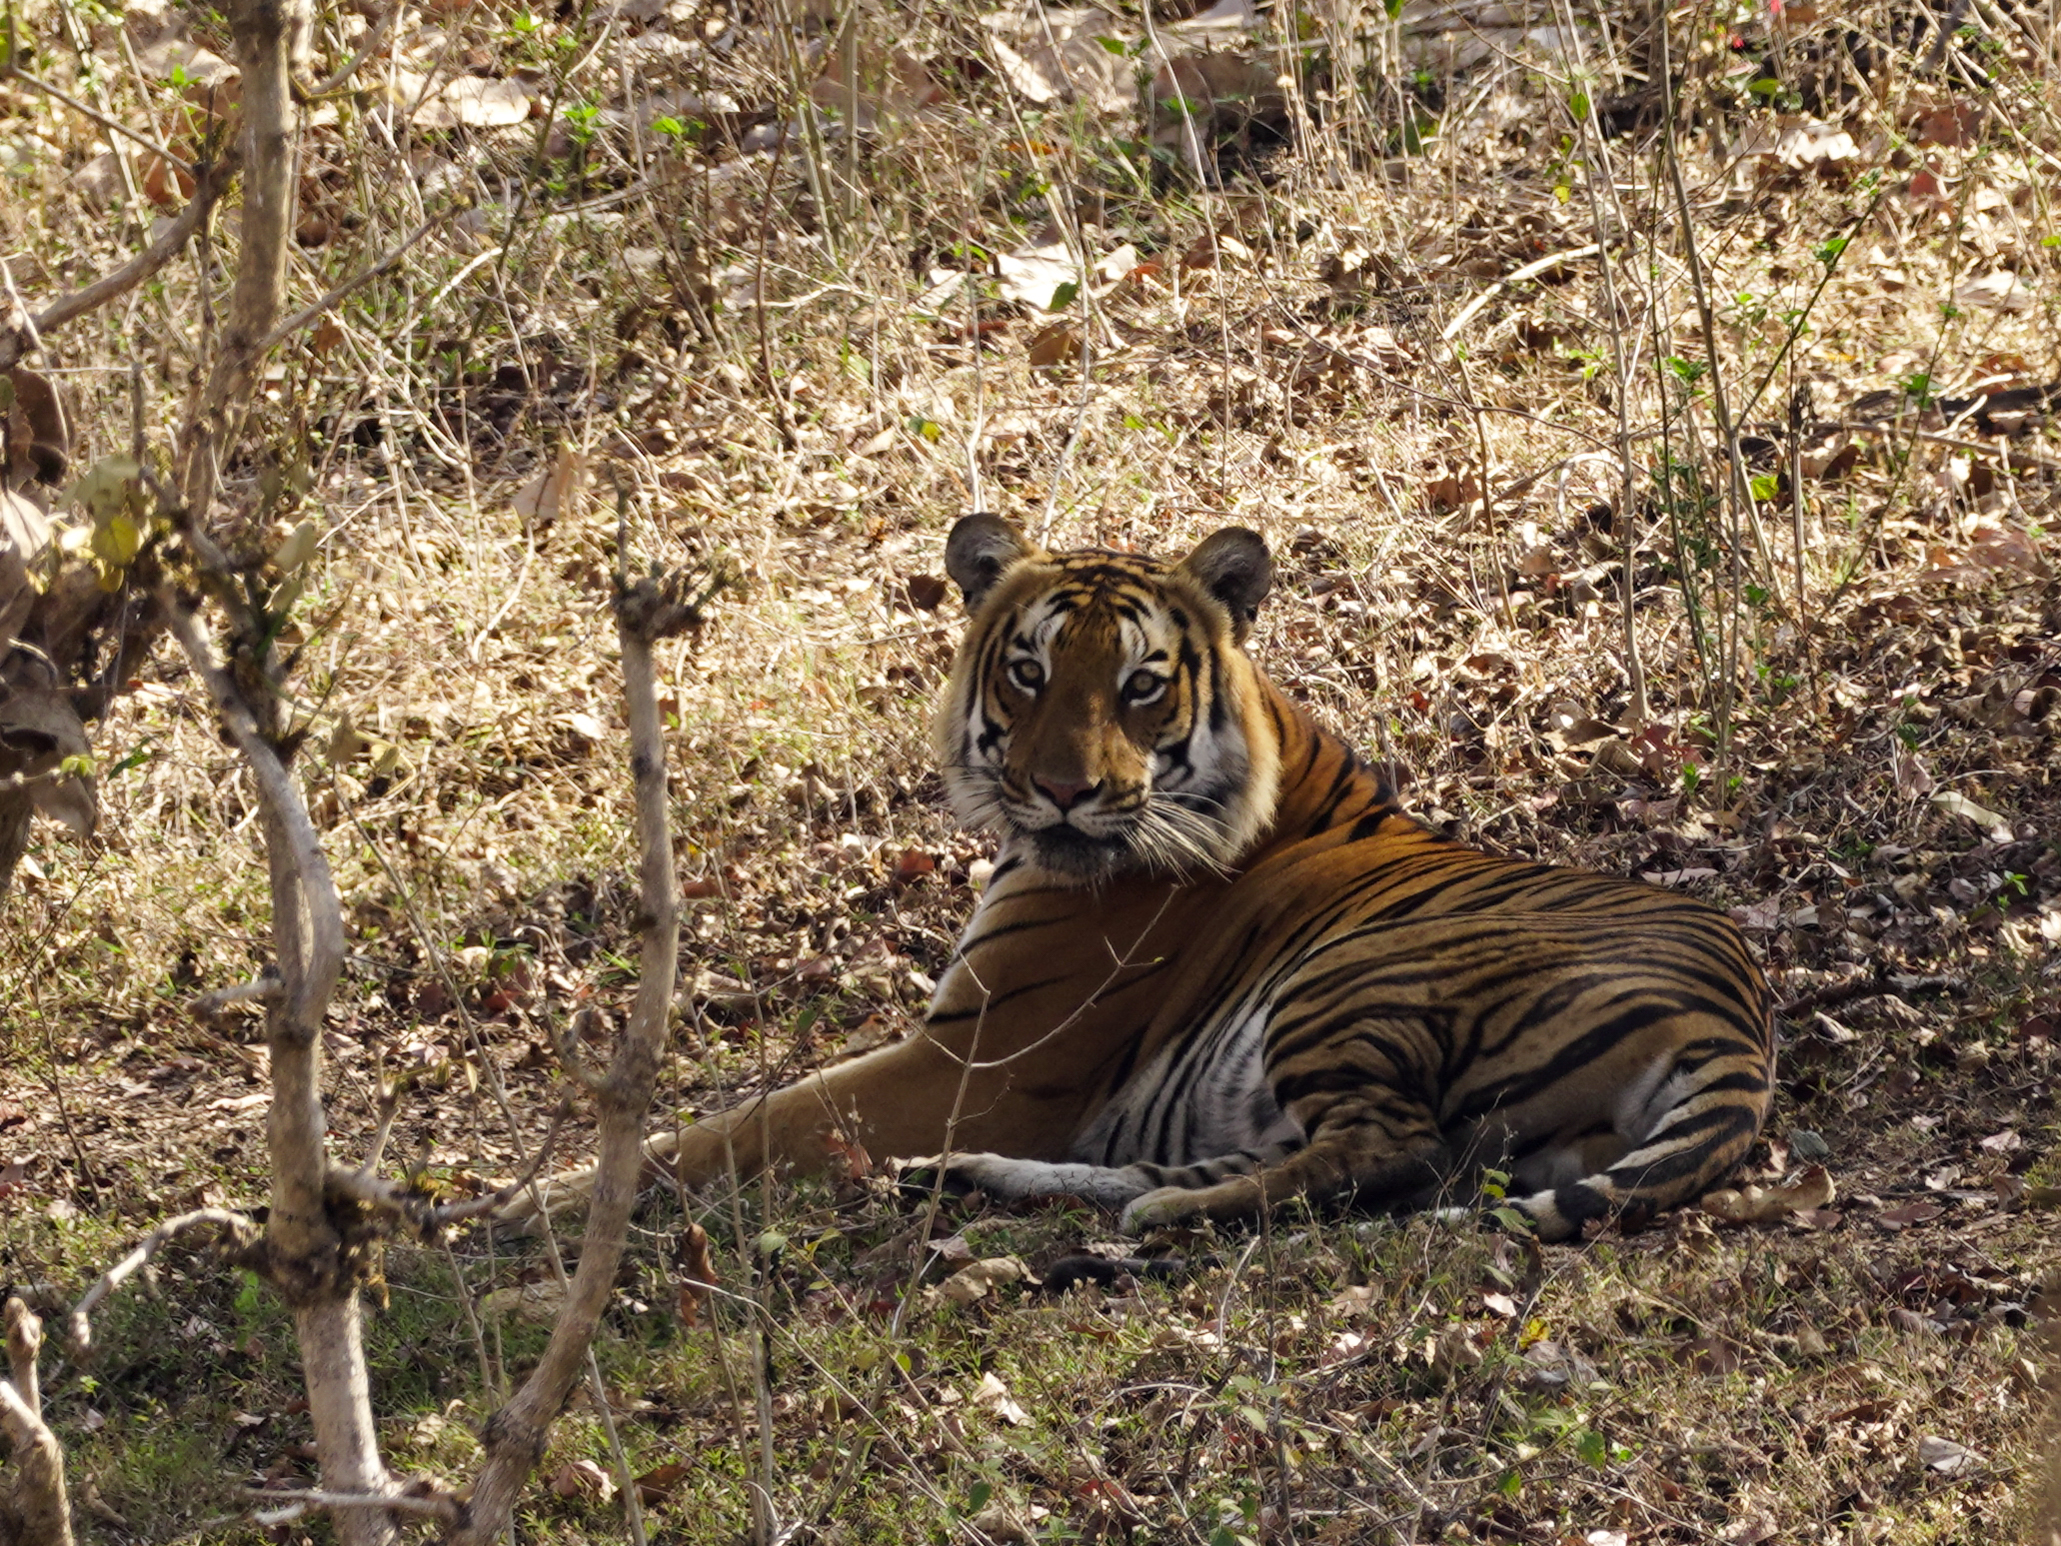
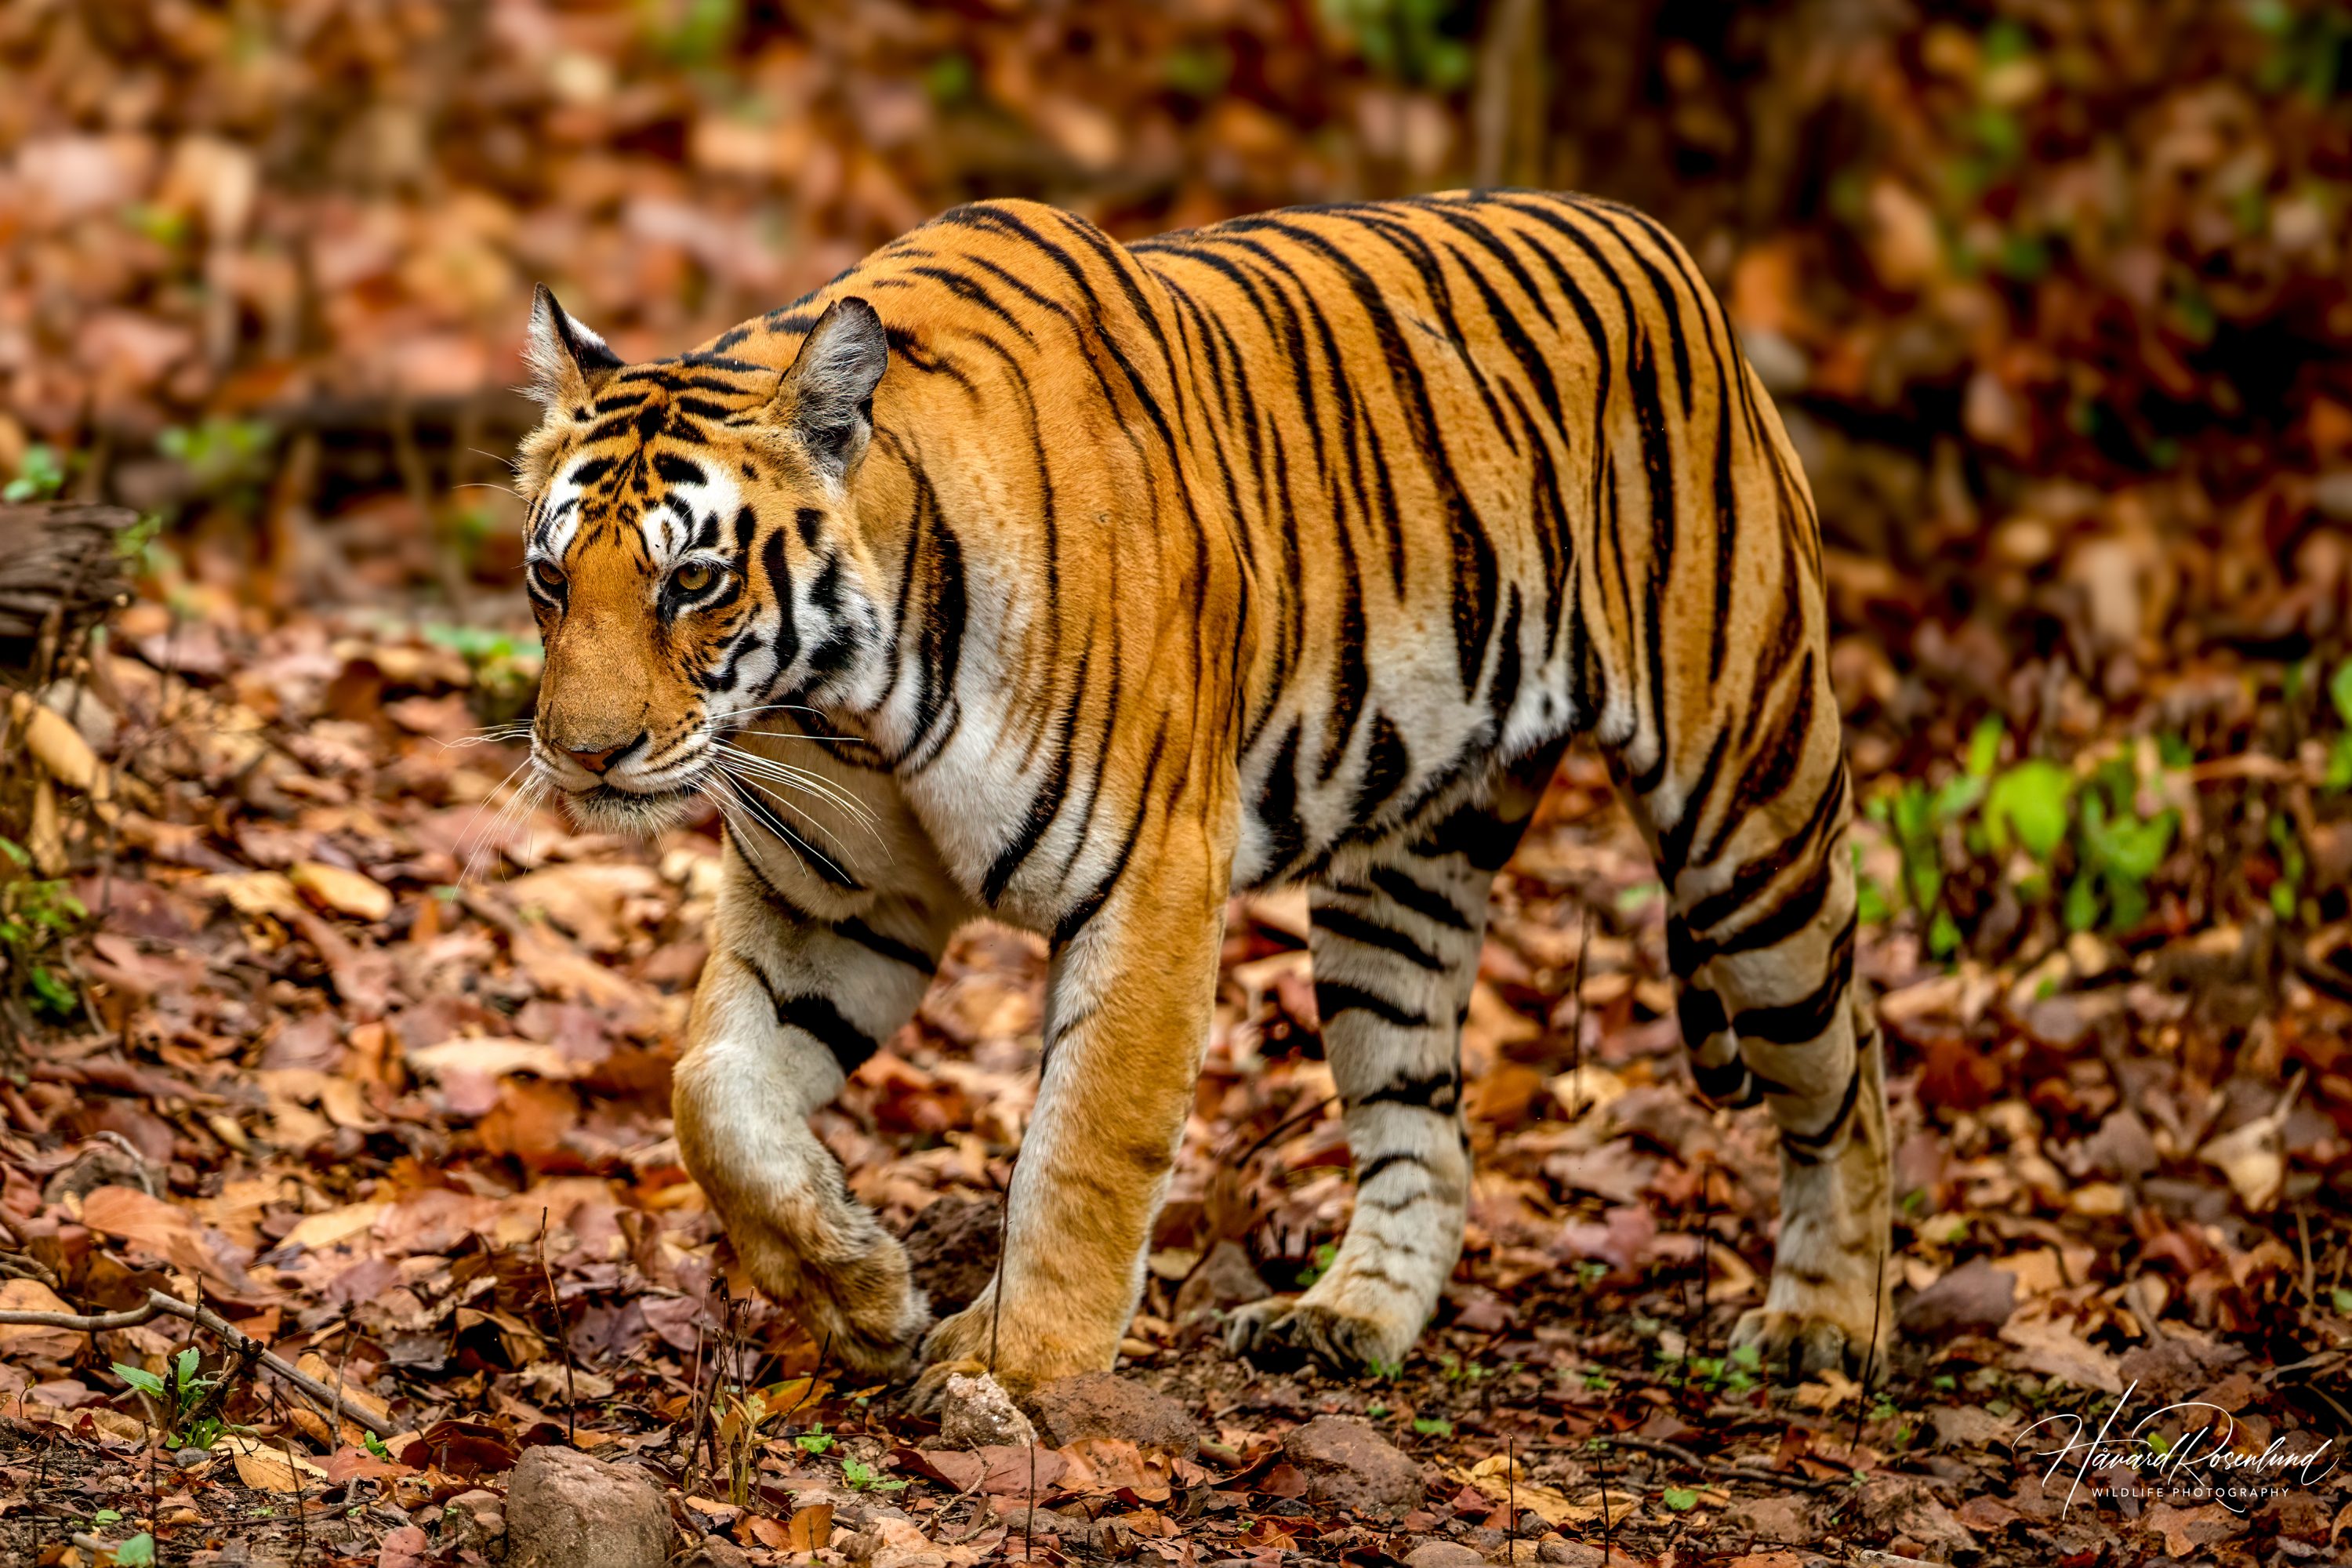
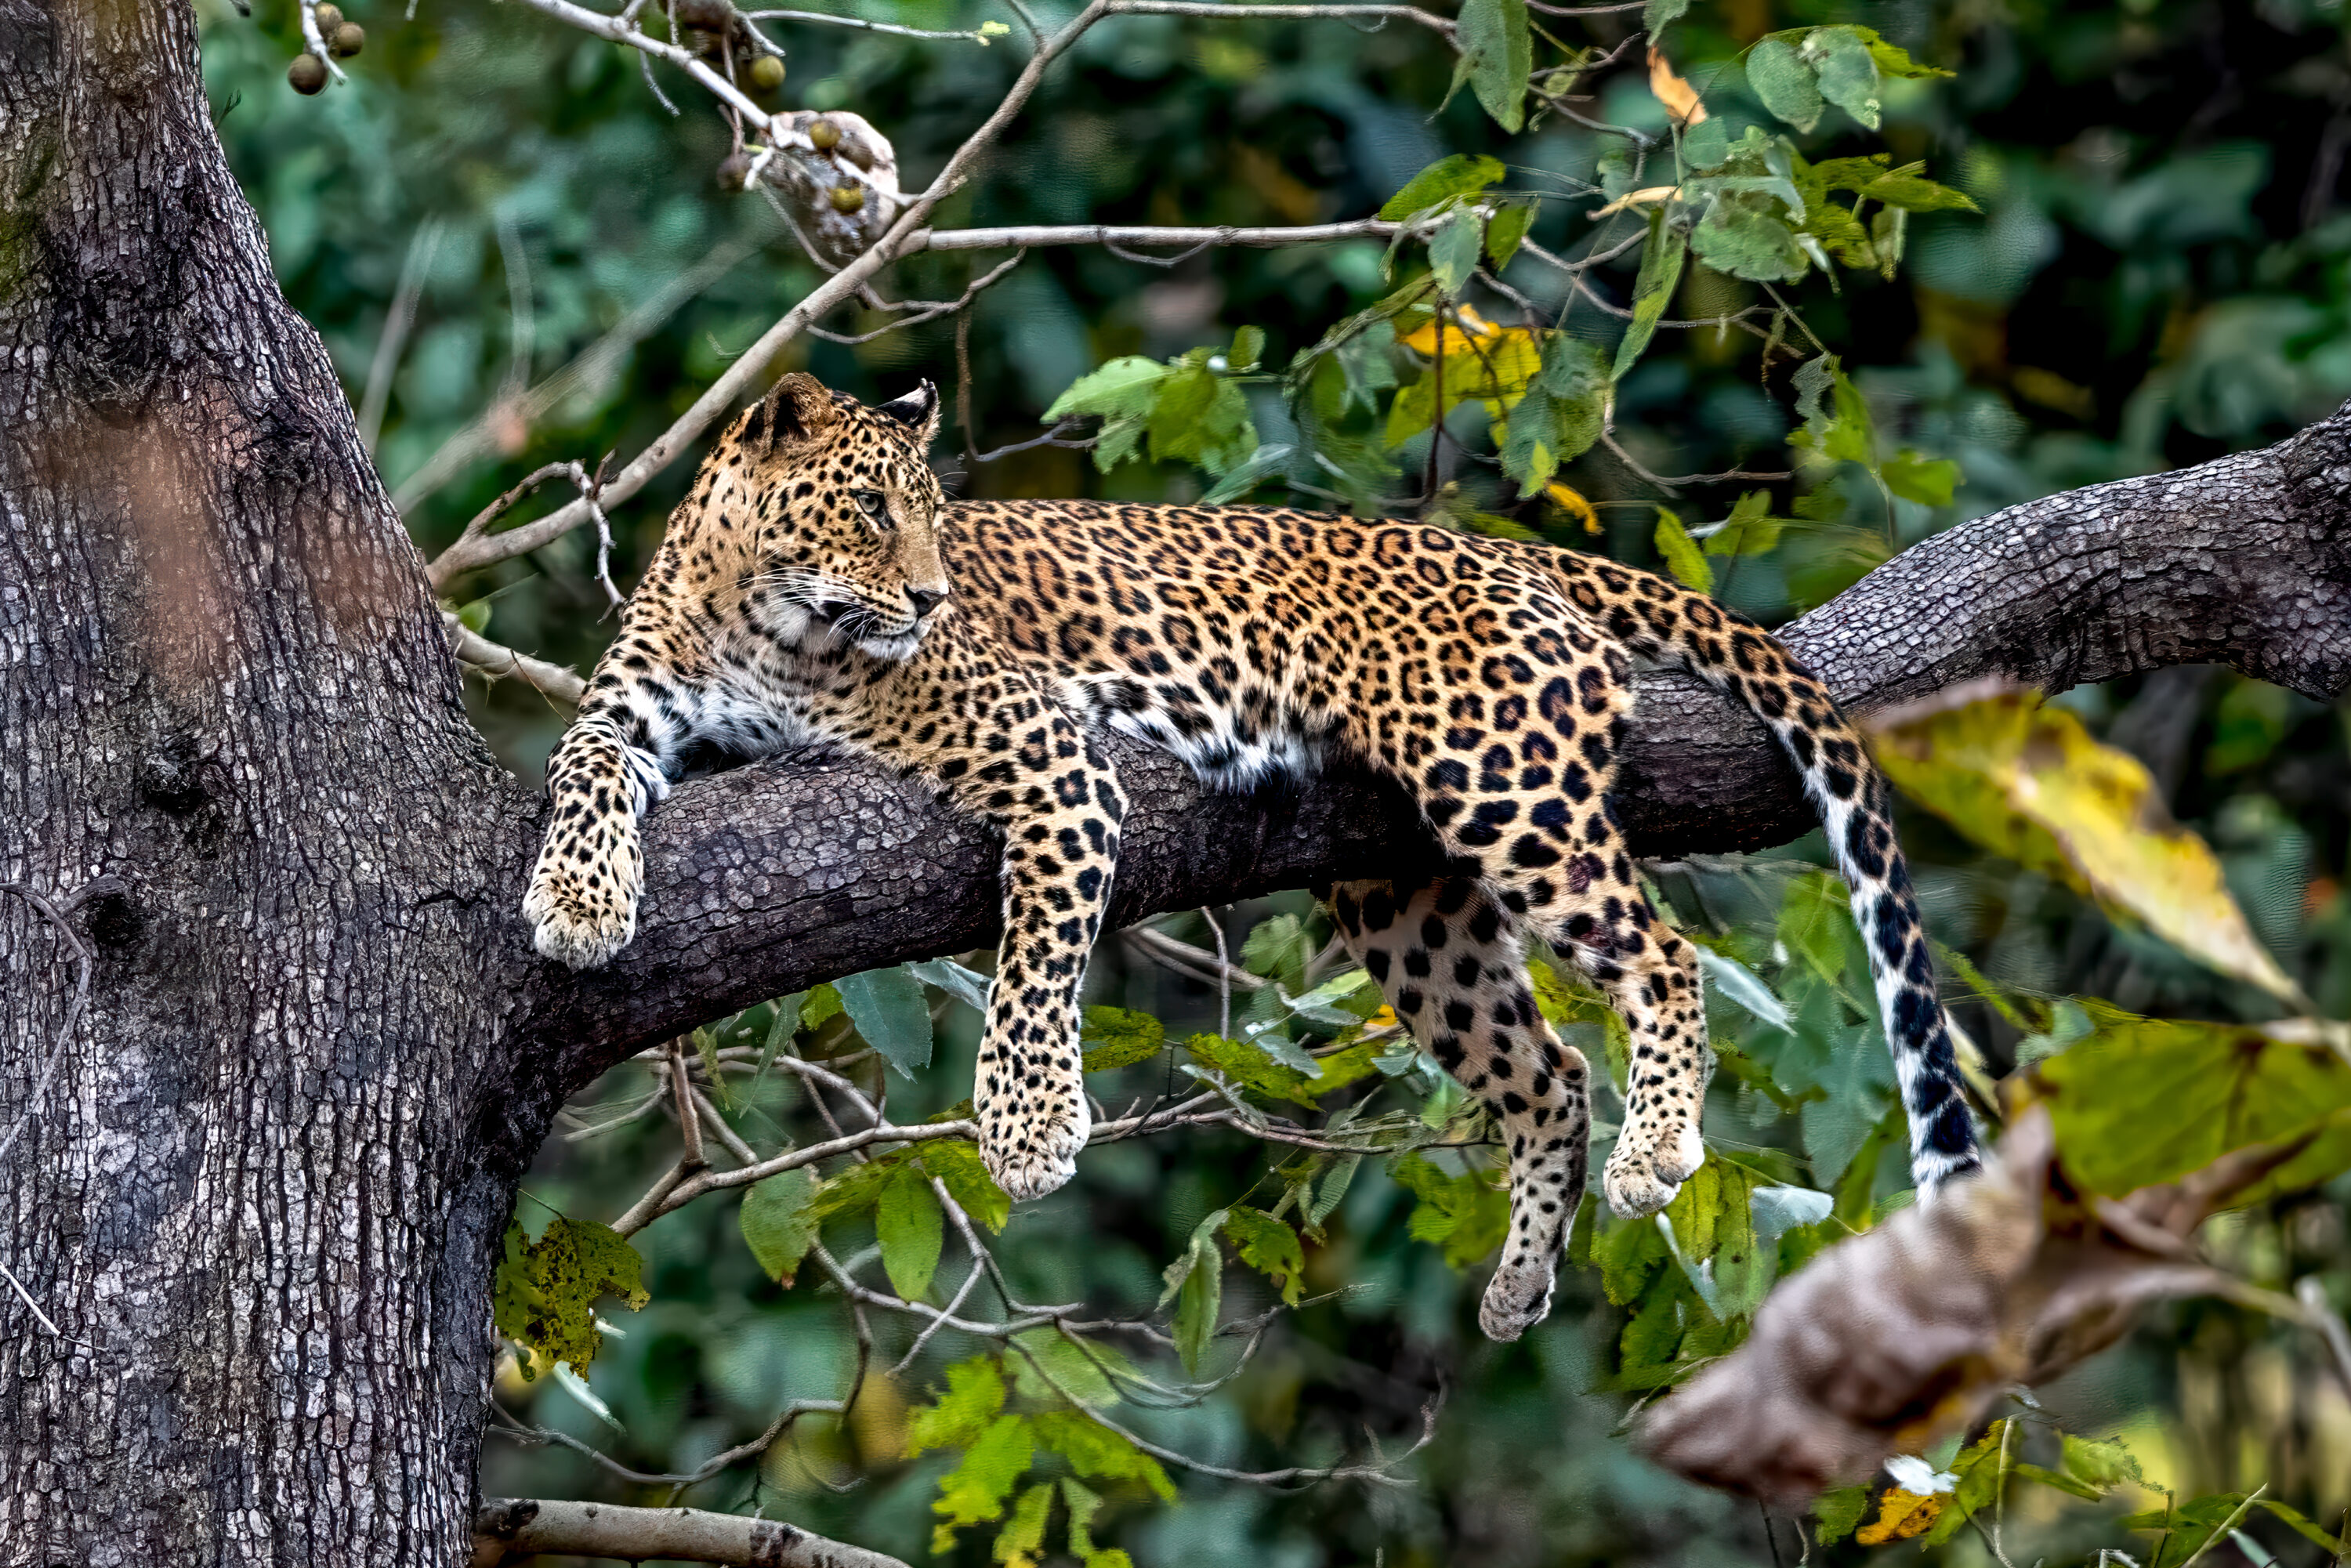
A spatial analysis of livestock losses around Panna Tiger Reserve, India found that distance to human settlements was the strongest model predictor of depredation risk for both tiger (Panthera tigris) and leopard (Panthera pardus). The study used documented livestock attacks from 2017–2022 and MaxEnt modelling to identify environmental conditions associated with recorded attack locations. In practical terms, MaxEnt compares conditions around known events with the surrounding landscape and maps where similar combinations occur. The resulting patterns show statistical associations with recorded depredation, not proof that settlement proximity itself caused the attacks.
High-risk areas differed between the two species
The paper reports 866 livestock depredation incidents in the wider dataset, including 627 attributed to tigers and 189 to leopards. Records lacking usable GPS coordinates or falling outside the modelling area were removed before the spatial models were fitted. MaxEnt classified 12.3% of the study area as high relative depredation risk for tiger and 4.7% as high risk for leopard. These percentages describe the share of mapped land assigned to the high-risk class, not the proportion of livestock expected to be attacked.
Distance to settlements had the largest contribution to both models: 39.2% for tiger and 33.1% for leopard. These figures are the variables’ contributions to the fitted MaxEnt models, not the percentage of attacks caused by settlement proximity. Tiger risk was highest near open forest at elevations of roughly 350–500 m, while leopard risk was concentrated closer to bush vegetation and within about 400 m of settlements. Other important predictors included distance to open forest, altitude, density of small ruminants such as sheep and goats, and distance to cropland.
The maps discriminate known attack sites well
The models had AUC values of 0.98 for tiger and 0.96 for leopard. AUC measures how well a model separates known event locations from background locations across possible thresholds; values this close to 1 indicate very strong discrimination within the study data. They do not mean that the models will correctly predict 98% or 96% of future attacks. The authors therefore present the maps as tools for identifying parts of the human–forest interface where prevention and livestock protection can be prioritised, rather than as counts of future depredation events.
Human–wildlife conflict
Related news
Key Movement Bottlenecks for Five Large Mammals Lay Outside Protected Areas in Tamil Nadu
A 2026 study of tiger, leopard, dhole, Asian elephant and gaur identified modelled movement bottlenecks outside protected areas,…
Read story →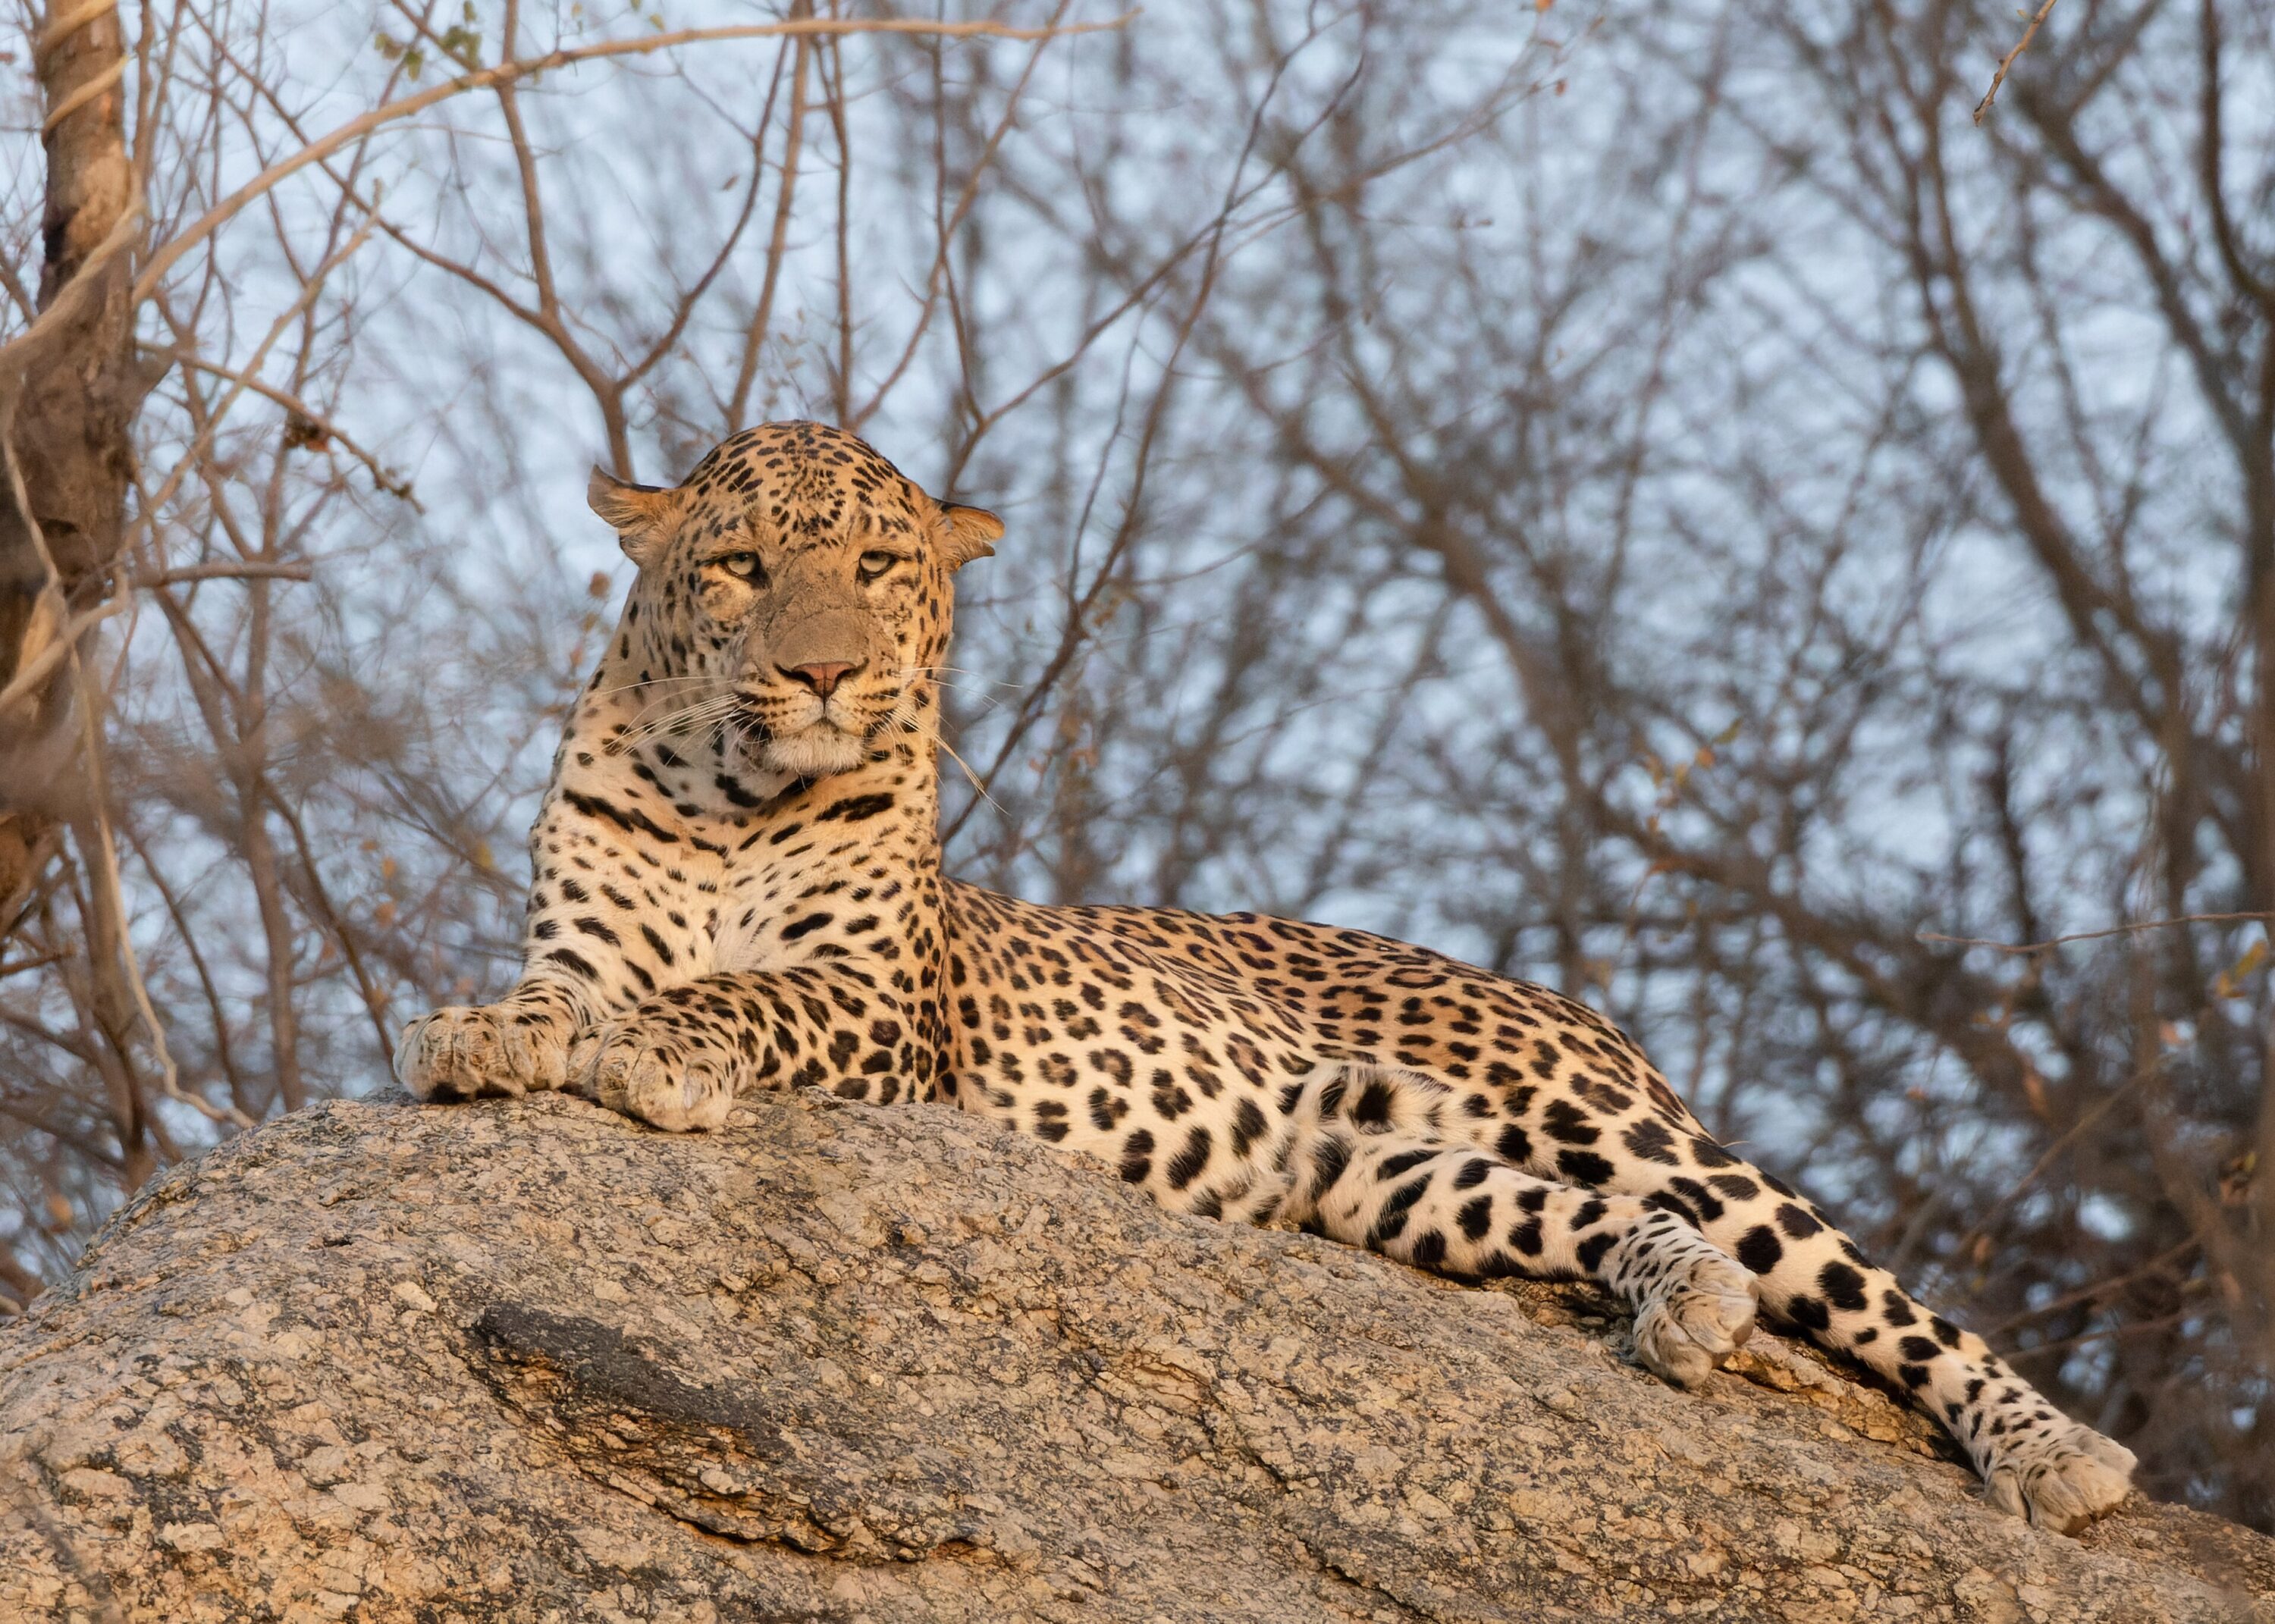
Habitat and Prey Were More Strongly Linked to Leopard Persistence Than Tiger Suppression in Bhutan
Bhutan's first nationwide leopard-density analysis estimated 1.02 leopards per 100 km², while repeated surveys showed that habitat and…
Read story →
Nine Indian species could anchor protection for biodiversity and carbon
A national analysis identifies nine threatened Indian vertebrates whose habitat could act as an anchor for protecting hundreds…
Read story →SPECIES IN THIS STORY
Species in this story
Independent research and conservation news archive
Did you find this information useful?
Wildlife Vagabond is independently built and maintained. Voluntary support helps cover source verification, hosting and continued work on research and conservation news.
Support Wildlife VagabondThe news archive will remain freely available.